
These are the most recent versions of tutorials I have developed and keep updating. They come from workshops and invited talks I give for students, colleagues, and computationally curious bystanders. You can also find these materials (and other bits and pieces) on my GitHub page.
If you find the materials useful, please cite them in your work. This helps me (and the computational research community) make the case that openly publishing digital materials, data, and code is a meaningful academic contribution.
I design and lead training in network analysis, visualization, and computational methods for universities, companies, and government agencies. To invite me to run a workshop at your institution, email workshop@ognyanova.net.
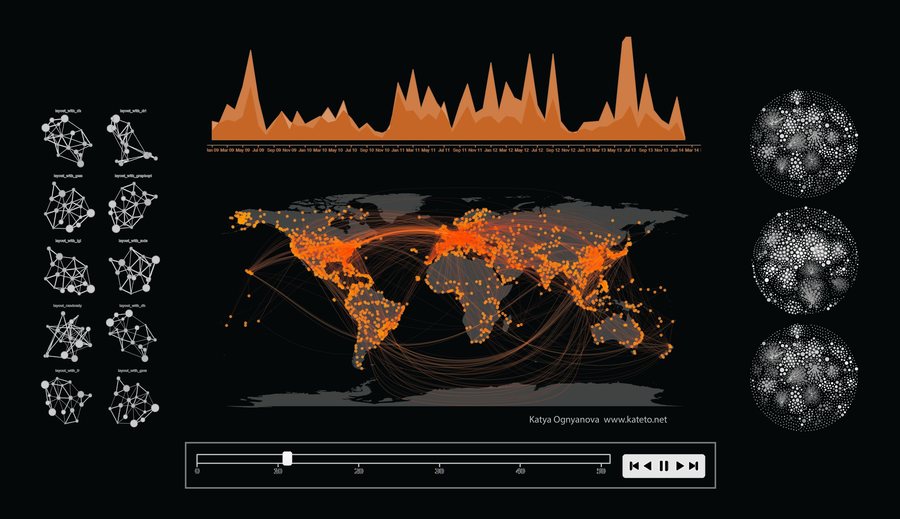
Static and dynamic network visualization with R
A comprehensive tutorial on network visualization with R. It covers data input and network formats, parameters and layouts for one-mode and bipartite graphs, interactive and animated visualizations, temporal networks, and networks on geographic maps.

Introduction to R for networks
An introduction to the R language and its use to process and analyze network data, including network formats, reading and cleaning network data, key graph metrics, and the basics of network visualization in R.

Network analysis with R and igraph
A basic introduction to R and the igraph package for network analysis and visualization: network generation, data input and processing, and the basics of graph analysis and visualization.
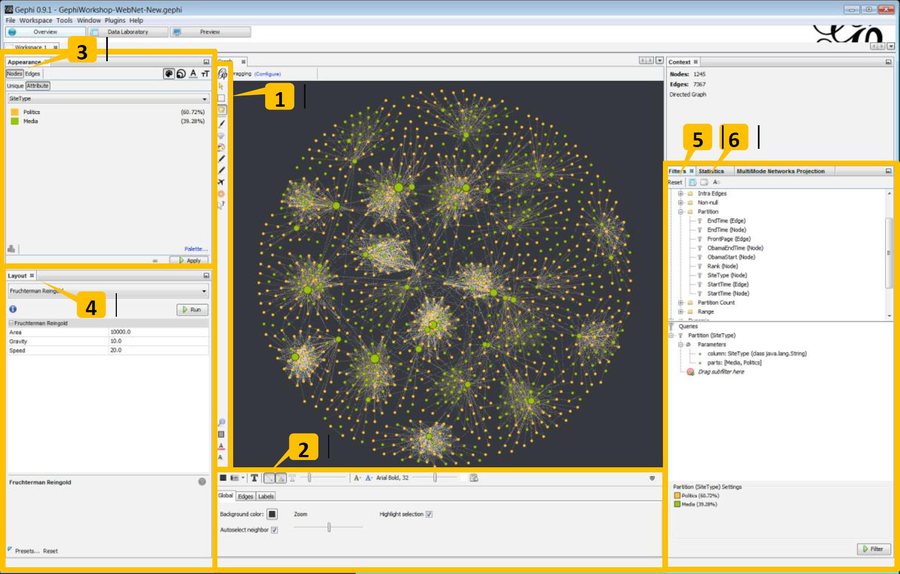
Network visualization with Gephi
Network visualization with Gephi: formats and input modes for structural and attribute data, visualization parameters and layout algorithms, dynamic visualization for longitudinal data, bipartite and multiplex graphs, and combining networks with geographic data.
Also useful
- Network datasets: where to find network data for research and teaching.
- Deleted congressional tweets: interactive charts, with the R code behind them.
- Facebook photo networks with Gephi and R: using images as network nodes.